考研英语如何写好图表类型作文?考研英语(二)的图表写作命题脱胎于雅思写作中的图表写作,都考查线(Line chart)、表(Table)、饼(Pie chart)、柱(Bar chart)四种图表,字数要求也是150词。
区别有两点:
①考研英语真题至今不考雅思图表写作中的混合图表(比如饼图+表格组合),也不考流程图和地图。至于将来考不考,大纲没说,自己斟酌。
②考研图表题还要求就图表信息发表个人评论(give your comments)。这一点,才是该题型的写作重点,是和雅思图表写作的本质区别。考生在描述完图表信息之后,要针对这些数据展现的趋势或特点去分析原因、影响,或给出建议。
所以,考研的图表作文,其实是就数据所显示的客观现象写一篇说明文。根据上述特点,为你定制“9句图表作文逻辑框架”如下。
◆ 9句图表作文逻辑框架
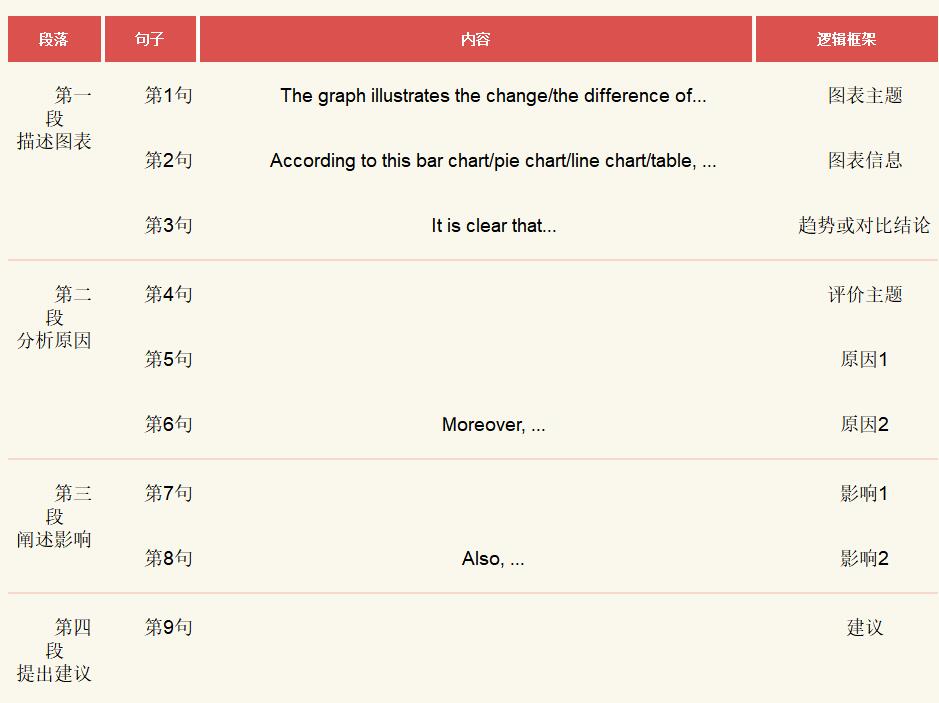
*以上逻辑框架中,可灵活变通之处很多:如果图表信息简单,首段可以只写两句话;如果你只能想到一个原因,那就再举个例子来证明,代替第二个原因的写作;同样,写完第一个影响,也可举例或展开,不用写第二影响;如果前面内容充实,字数已够,就不用写建议。
题目要求give your comments,你当然可以在原因、影响、建议三者中,只挑选任何一个展开来写。以上逻辑框设计架将三种评论方向都囊括在内,是为了助你拓展思路,保证内容充实,达到字数要求。
◆ 4大图表写作技能
写作之前,我们先学习“描述图表”“分析原因”“阐述影响”“提出建议”,这四个方面的英语写作技能、句型和知识点。
描述图表
线表饼柱各自特点
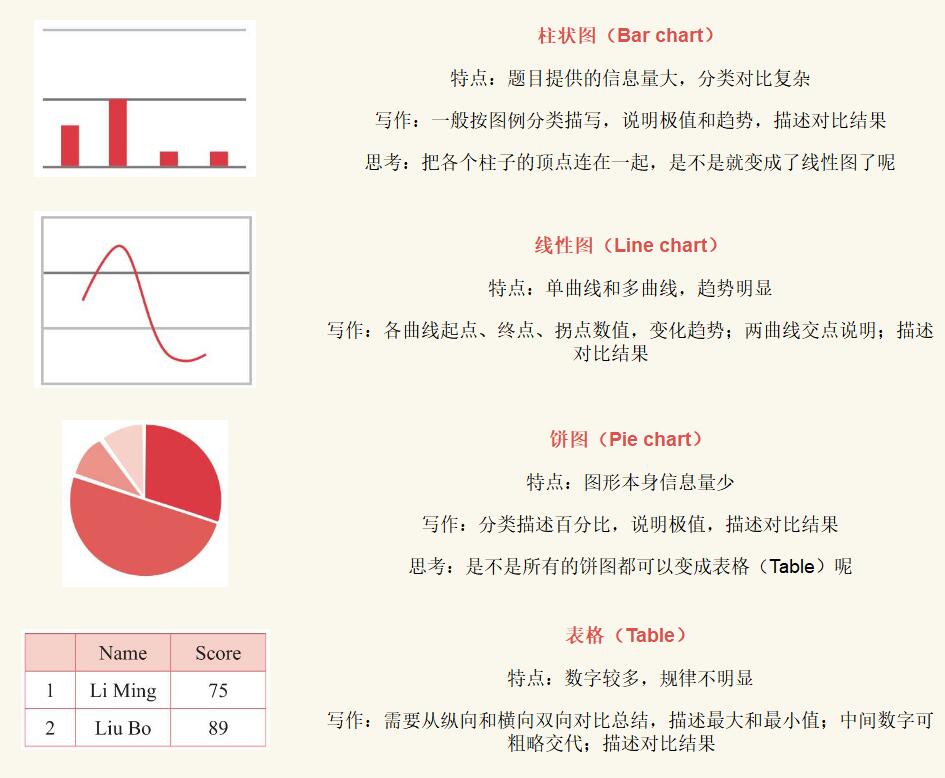
写作时态首段描述图表,注意图表中是否有年代时间。如是对过去年份的数据统计则用一般过去时;如无,则用一般现在时。
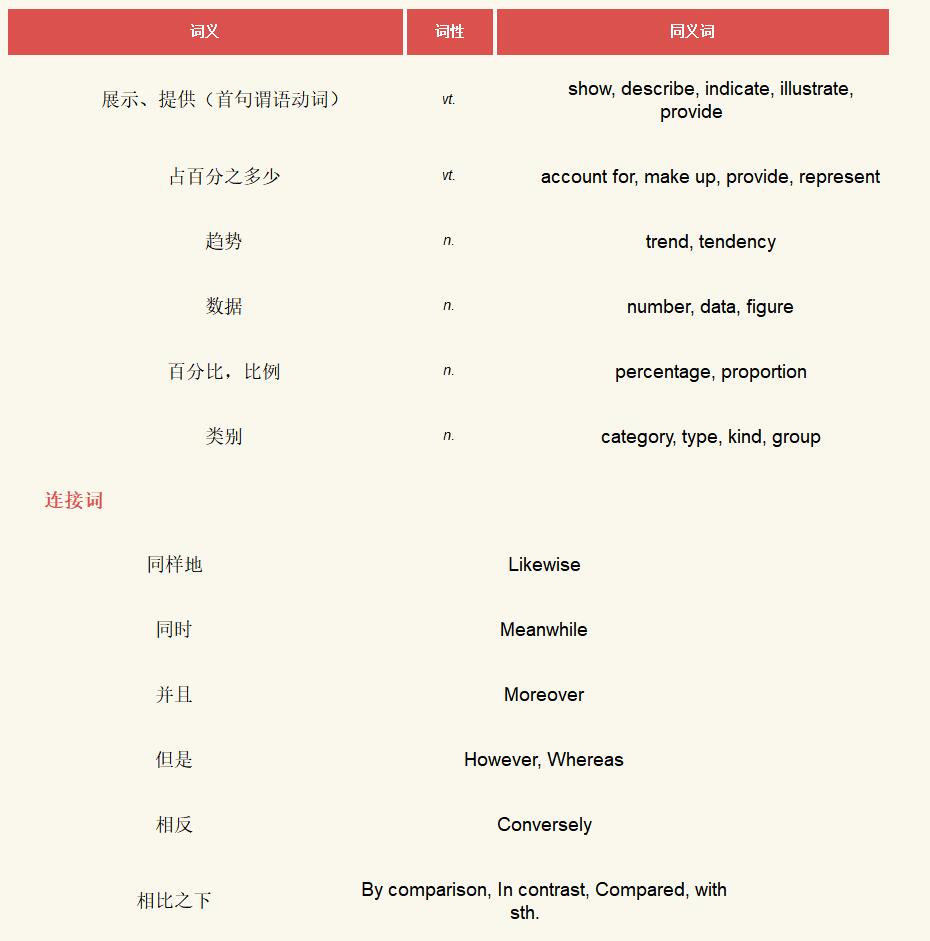
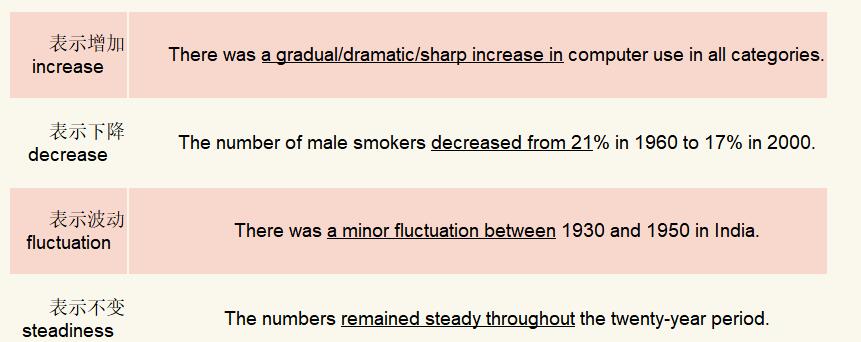
必备同义词替换
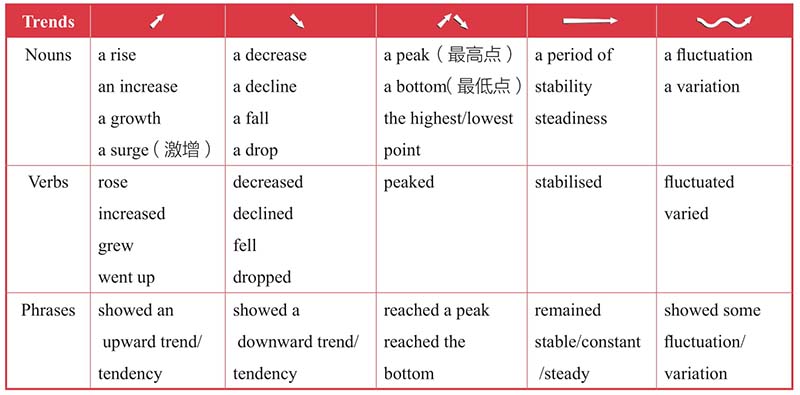
四大趋势描述
天下间的数据变化的基本趋势只有四种:上升、下降、波动、不变。所以要背诵下面四个句子。
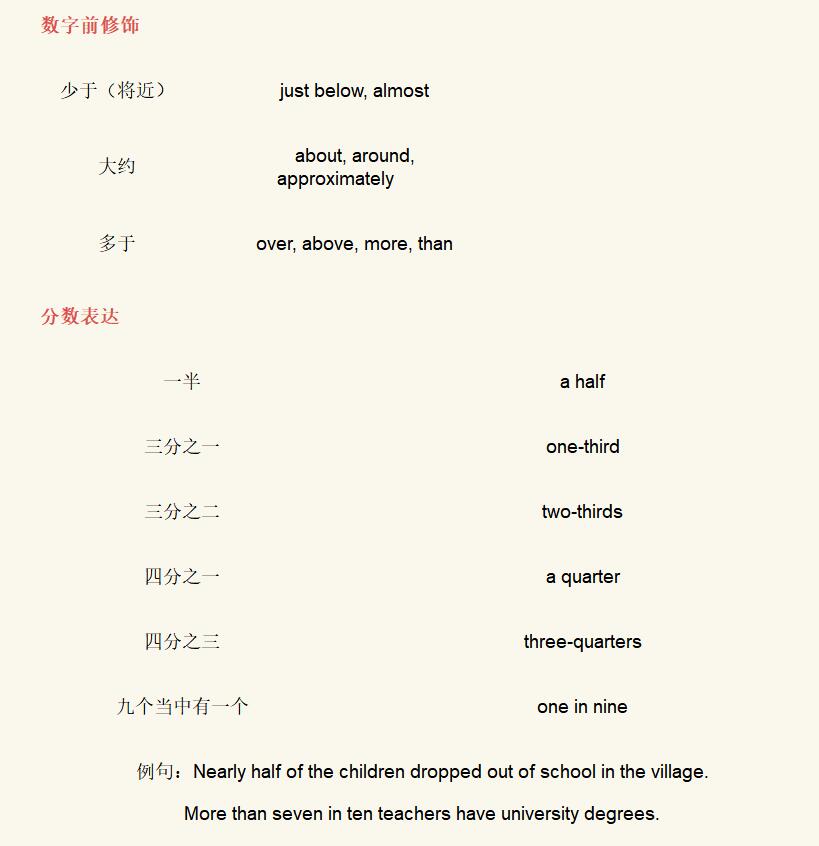
更多灵活表达可掌握
趋势程度修饰
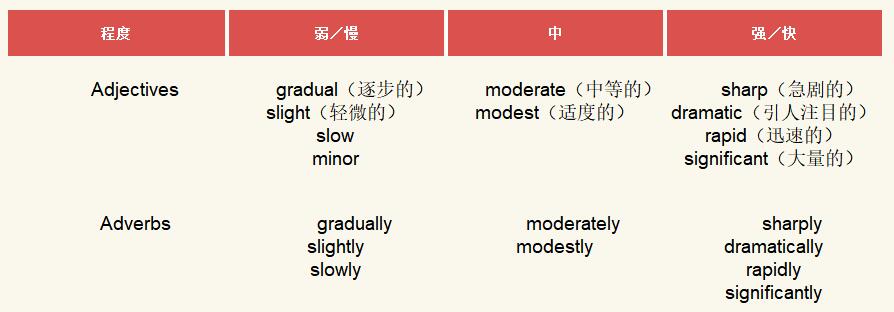
几个高级词汇:
soar (soared)激增
skyrocket飞涨
plummet (plummeted)暴跌
plateau(plateaued)高原(上升后的)稳定水平
reached a plateau达到一个高度
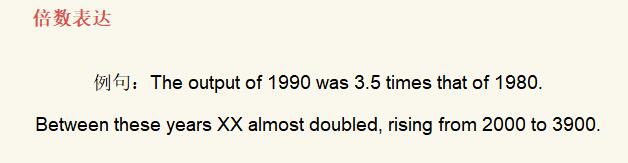
三大核心句型
背诵下面三个核心句型,并学习下面的例句拓展,所有图表数据你就都可以描述了。
1. 主(The number of ...)+谓(increased/decreased)+from...to...
The number of male smokers decreased from 21% in 1960to 17% in 2000.
The number increased dramatically and then peaked at 400 in 1990.
The number plummeted, reaching the bottom at 100in1998.
The average income of the staff increased by 50 percent compared with last year.
The number of marriages remained stable at this level over the next decade.
During this 25-year period the consumption of beef and lamb fell dramatically to approximately 100 grams and 55grams respectively.
In the first quarter of this year Apple witnessed an increase of 30 per cent in net profit.
Similarly, the cost of insurance saw a rising trend, growing from only 2% to 8% by 2001.
In contrast, the cost of furniture showed an opposite trend.
2. There be句型
There was a downward trend of male smokers, from 21%in 1960 to 17% in 2000.
There was a sharp increase in computer use in all categories.
There was a steadily increasing tendency of personal computers in households in the US.
There was a minor fluctuation between 1930 and 1950 in India.
3. 主语+accounted for+百分数+of ...
Male smokers accounted for 21% of American adults in 1960.
Males accounted for 10% of the whole workforce.
Coal provided 40.2 percent of whole in 1970.
Students made up nearly 20% of the group.
Food constituted over 23% of my family’s expense.
分析原因
The main reason behind this trend is that...
What has contributed to this change? In the first place...In the second place...
The explanation for this phenomenon involves many complex reasons...
There are a variety of reasons for this phenomenon.
The reasons can be listed as follows. For one thing...For another...
It is no easy to identify the reason for this change which involve several complicated factors.
A number of factors could account for/lead to/contribute to/result in ...
阐述影响
This change will have a significant influence/impact on...
This change might result in...
The implications of this chart is that ...
This could bring the unexpected consequence.
Obviously, if we don’t control the problem, the chances are...
No doubt, unless we take effective measures, it is very likely that...
提出建议
In order to solve this problem, we should...
It would be better (not) to do sth.
In my personal opinion, it would be wise to do sth.
It is important/useful to do sth.
It also helps to do sth.